Research Article
Postural Stability Induced by Supervised Physical Training may improve also Oxygen Cost of Exercise and Walking Capacity in Post-Menopause, Obese Women

Fernanda Velluzzi1, Massimiliano Pau2, Andrea Loviselli1, Raffaele Milia3, Daniela Lai1, Daniele Concu4, Gianmarco Angius4, Abdallah Raweh5, Andrea Fois6 and Alberto Concu3,4,5*
1Obesity Centre, Medical Faculty of the University of Cagliari, Italy
2Department of Mechanical, Chemical and Materials Engineering, University of Cagliari, Italy
3Sports Physiology Laboratory, Department of Medical Sciences, University of Cagliari, Italy
42C Technologies Ltd, Academic Spin-off, University of Cagliari, Italy
5Medical Sciences Faculty, the LUdeS Foundation Higher Education Institution, Malta
6EventFeel Ltd, Cagliari, Italy
*Address for Correspondence: Alberto Concu, Sports Physiology Laboratory, Department of Medical Sciences, University of Cagliari, Italy, Tel: +393386239125; Email: [email protected]
Dates: Submitted: 21 December 2016; Approved: 06 January 2017; Published: 09 January 2017
How to cite this article: Velluzzi F, Pau M, Loviselli A, Milia R, Lai D, et al. Postural Stability Induced by Supervised Physical Training may improve also Oxygen Cost of Exercise and Walking Capacity in Post-Menopause, Obese Women. Heighpubs J Nov Physiother Rehabil. 2017; 1: 001-011.
DOI: 10.29328/journal.jnpr.1001001
Copyright License: © 2017 Concu et al. This is an open access article distributed under the Creative Commons Attribution License, which permits unrestricted use, distribution, and reproduction in any medium, provided the original work is properly cited.
Keywords: Post-menopausal obese women; Supervised exercise training; Postural stability; Exercise oxygen cost
ABSTRACT
We utilized the training impulses method to numerically quantify the volume of physical exercise to be prescribed to postmenopausal obese women in such a way of obtain the best possible improvement of their health-related quality of life. Nine women (57±4 years, 89±2 kg, 157±9 cm) carried out 3-months of exercise training (3 session/week each lasting 80 min) under the supervision of skilled operators which indirectly calculated the volume of physical exercise by assessing heart rate values while patient exercised and making sure that the workload corresponded to 50-60% of their maximum oxygen uptake. Before and after training anthropometric, functional and biomechanical variables were assessed. After training patients shoved statistically signifi cant (P<0.05) reduction in body mass (-2%) and body mass index (-4%), waist circumference (-4%), total (-6%) and LDL (-26%) serum cholesterol and glycaemia (-8%), diastolic arterial blood pressure (-14%), and oxygen cost (-14%) at the maximum workload during incremental cardiopulmonary test, the sway area from unipedal stance (right leg) of 20 s on a pressure platform (-49%), while increased both free fat body mass percentage (+3%) and space covered during the six minute walk test (+11%). It was concluded that, when an exercise protocol is carried out by postmenopausal obese women and the volume of exercise is instrumentally controlled by experienced operators, it could result in an effective benefi t on the quality of life of these patients since they ameliorate some critical anthropometric and functional parameters.
INTRODUCTION
A commonly accepted definition of body balance is that this is a physiological process that maintains the centre of gravity within the body support base and for this it needs of constant adjustments from muscular activity and joint placement [1]. The increase of the adipose mass which results in overweight or even obesity can cause a reduction of efficiency in the mechanisms controlling the body balance, and this may be a major contributing factor to body falls [2].
In fact, increased postural sway during quiet standing is often associated with increased body weight [3], and the consequent postural instability is directly related to the risk of falling [4]. In post-menopausal women, Hita-Contreras et al. [5] found that a body mass index higher than 25 kg m-2 can be already considered as a risk factor for falls. Tesdale et al. [6], in obese people observed a strong linear relationship between the magnitude of the weight loss and the improvement in balance control, or a confirmation that body mass is a strong conditioning factor of the static and dynamic posture.
Concerning the possible beneficial effect of the exercise training on obese people, Bellafiore et al. [7] showed that, in overweight post-menopausal women who carried out a five-week exercise program, there was a significant increase in lean mass with an improvement in their ability of maintain unipedal static balance. Recently, Smith-Ryan et al. [8] found that 3-week of high-intensity interval training, i.e. a type of exercise with a high release of muscle power but with a low energy expenditure, which was carried out by thirty women with a mean body mass index of 32 kg m-2, resulted in a significant increase in peak power output and in the peak oxygen uptake with a significant reduction in fat mass. However, when the exercise training have been carried out up to 12 weeks and continuously but at a low release of muscle power, Dajio et al. [9] showed in post-menopausal women aged over 50 years a significant reduction of body mass and of the waist circumference and glycaemia, while was increased lean body mass and the maximum oxygen uptake. Data of Smith-Ryan et al. and Dajio et al. seem to confirm that both the high intensity-low lasting [10] and the low intensity-long lasting of the exercise training [11] are able to ameliorate morphofunctional status in obese women.
In obese people vascular dysfunction may play a pivotal role in the development of atherosclerosis [12] being cardiovascular disease the third leading cause of death among women [13]. Experimental evidences agree in indicating that increased body fat is associated with increased reactive oxygen species production [14] and with an impaired nitric oxide-mediated endothelium-dependent vasodilation [15]. From all the above experimental evidences, and in agreement with observations made by Mason et al. [16], adequate exercise training is recommended for preventing weight gain and to reduce the occurrence of the cardio-vascular, metabolic and falling risks associated with obesity in post-menopausal obese women (PMOW).
PMOW seem to be strongly candidate to obesity [17], and notwithstanding the plethora of information on correlations between physical exercises and obesity associated changes in physical fitness, functional fitness, serum lipid levels and maximal aerobic capacity, it is not still well known what exercise intensity and/or what type of exercises is required to alleviate such detrimental phenomena in these patients.
The aim of the experiments presented here was that of utilize the previously validated method of training impulses [18-20] to numerically quantify the volume of physical exercise to be prescribed to PMOW in such a way of obtain the best possible improvement of their health-related quality of life.
METHODS
Subjects
In order to minimize dropouts in the protocol of physical activity, we chose to recruit voluntary PMOW among the patients of the Obesity Centre, at the University of Cagliari, Italy, which were highly motivated to perform an exercise protocol aimed at improving their diseased condition.
The admission criteria were: natural condition of postmenopausal, no hormone replacement therapy, more than 50 years aged, body mass index higher than 30 kg m-2, less than 150 min of moderate physical activity/week. Moreover, serum levels of female sexual hormones were previously assessed to ensure a reached condition of postmenopausal and chosen limit values were: estradiol from 12 to 30 pg/ml [21], FSH and LH, respectively, from 30 to 120 mUI/ml and from 9 to 50 mUI/ml [22].
Exclusion criteria were: surgical menopause, degenerative disease of the cardiovascular and respiratory apparatus, of the nervous-endocrine-metabolic system and of the muscle-skeletal apparatus, diabetes mellitus, thyroid dysfunction, mental disorders, tobacco smokers and alcohol abuse.
Written informed consent was obtained prior to participation. The study protocol was approved by the local ethical committee.
Twenty-two volunteers responded to our call, each of whom was subjected to a thorough investigation of medical history and to an examination by physicians of the obesity centre at the University of Cagliari, Italy. After these medical controls only nine subjects presented the required characteristics and were engaged in these experiments.
Concerning the dietary intake, participants were encouraged to follow the Food Guide Pyramid [23] from the United States Department of Agriculture, and nutritionists of the obesity centre provided to daily personalize individual caloric supply.
Experiments were carried out by 9 PMOW aged 57±4 years, which body mass (W) was of 88.8±2.5 kg and were 157.1±9.2 cm high (H). W and H were measured by means of a mechanical precision scales (mod. Astra, GIMA-Italy).
In each subject was calculated the Body mass index (BMI) as the ratio between W and H2 . A non-elastic metric tape was also utilized to measure the waist circumference (WC), and this measure was made by choosing the minimum circumference between the ribcage and navel with the subject standing and abdominal muscles relaxed. The percentage of free fat mass (FFM) was also assessed in each patient by utilizing a bioimpedance device (mod. 310e, Biodynamics, USA).
Training protocol
To quantify the volume of exercise carried out weekly by each patient (EXV) we utilized the method of the training impulses (TRIMP) which is described in detail in previous publications [20]. In short, this method is based on the heart rate measurements while exercising [18] and it measures, in arbitrary units, the EXV weekly released by each patient. Starting from several laboratory tests, previously made in such a way of individuate the EXV as the more efficacious to induce changes in anthropometric and functional variables, we choose a TRIMP which corresponded to 50~60% of the oxygen consumption maximum value [19]. Each engaged patient went, three times at week, to an indoor gym where she carried out a session of physical activity lasting about 80 min. The all training duration was of 12 weeks and physical activity and heart rate acquisition were constantly supervised by a skilled operator.
In each session, the types of physical activity were designed as follows:
- General exercises of heating and stretching (15 min);
- Free-body exercises comprising series from 3-5 min, Repeated 2-4 times, with 30 s - 1 min resting between one series of exercises and the other (15 min);
- Exercises with small tools (clubs, dumbbells, medicine ball) comprising series from 2-4 min, repeated 3-5 times with weights from 0.5 kg to 3 kg, with 1 min resting between one series of exercises and the other (20 min).
- Aerobic activity consisting of walking/running to the treadmill or in open ground (20 min).
- Cool-down exercises (10 min).
The types (c) and (d) of physical activity alternated in the succession of training sessions
Functional evaluation protocols
Each subject performed two series of functional evaluations which were carried out, respectively, before the trial entry (Tin) and after 3 months of continuous training (Tout). At each scheduled time each patient was doing the following tests:
- Six minute walk test: One week before the Tin, each patient performed a six minute walk test (6MWT) that consisted in measuring the distance that she could quickly walk on a flat, hard surface in a period of 6 minutes [24]. The length of the corridor was marked every 3 m. The walking course was of 30 m in length and a turnaround points was marked with a cone and a starting line which marked the beginning and end of each 60-m lap, was indicated on the floor using brightly colored tape [25]. Participants were asked to be dressed in comfortable clothing and walking shoes. The 6MWT was repeated by each patient one day after Tout.
- Baropodometric evaluation test: Four days before Tin, for each patient a baropodometric evaluation test (BPT) was done which consisted in valuing the plantar pressure distribution acquired by asking to her to stand, with open eyes, as still as possible on a pressure platform (Footscan† 0.5 system, RS Scan International, Belgium) for 20 s at unipedal stance of the right (SwayR) or left (SwayL) leg randomly. Then, after 30 min of seated at rest, the test was repeated by standing with the other leg. The BPT was repeated by each patient one day after Tout and 6 hours after the 6MWT. This type of platform was previously employed in several sport-related and clinical biomechanics studies [26,27] to investigate subjects’ plantar pressures in static and dynamic conditions; thus, the data acquired by such equipment can be considered reliable. The pressure platform software provides the confidence ellipse of the centre of pressure (COP) sway which is a measure of the surface described by the envelope of the positions of the COP during the 20 s of the test, and is defined as the surface (mm2) that contains (with 95% probability) the individual points that compose the sway [26].
- Cardiopulmonariy evaluation test: Three days before Tin, each patient underwent a cardiopulmonary exercise test (CPX) being connected to an ergometric system (mod. Ergocomp EL 1200, Marquette, Italy) for ECG data, and to a mass spectrometer (mod. II-CPX Express, Medgraphics, USA) in order to obtain metabolic and respiratory data [28]. She underwent to a cycle-ergometer incremental test (20W every 3 min,) up to volitional exhaustion, followed by 5 min of recovery. By utilizing a brachial sphygmomanometer arterial blood pressures have been taken every last minute of each step and during recovery. Data were then analysed, in order to obtain maximum values of: workload (WATT), oxygen uptake (VO2), heart rate (HR), oxygen pulse (OxP) by dividing VO2 per HR, systolic and diastolic blood pressures (SAP, DAP), and maximum oxidative cost of exercise (COX) which was calculated as the ratio between VO2 and WATT. The CPX was repeated from each patient two days after Tout.
- Blood samples test: One day before Tin, from every patient was taken a blood sample from the median cubital vein of an arm and serum levels of glucose (GLY), total cholesterol (ColT), high-density lipoprotein cholesterol (HDL), low-density lipoprotein cholesterol (LDL), were measured using the ADVIA 1650 chemistry analyzer (Siemens,Munich, Germany). The vein blood samples were still taken two days after Tout and two hours before the CPX.
DATA ANALYSIS
Due to the asymmetric distribution of the data, the visualization of the assessed variables was made by means of the box and whiskers plots [29] in which we have also included the spread of data. Box plots encode five characteristics of a given distribution concerning position and length. In fact, each box ranges from the 1st quartile (Q1) to the 3rd quartile (Q3) of the distribution. So the box length is the interquartile range (IQR) and it contains the central 50% of the data. A line across the box indicates the statistical median, or Q2, whose position gives visual information on the skew distribution of data. The whiskers are lines extending from 1st to 3rd quartile, respectively, to the most extreme data points within Q1-1.5 x IQR and Q3 + 1.5 x IQR. Each outlier outside the whiskers is generally represented by an individual mark, but quartiles are not conditioned by outliers and preserve information about the centre and spread of data [30].
Moreover, due to the modest sample size of our data, when comparing the values assessed in Tin with those assessed in Tout, we have chosen the nonparametric Wilcoxon signed rank test. In all the comparisons the statistical significance was established as a P value <0.05. Statistical tests were carried out utilizing commercially available software (MedCalc, Belgium).
RESULTS
All the engaged PMOW had completed the programmed protocol of supervised exercise training.
Figure 1A shows that the box concerning Wout values is positioned down that concerning the Win values. Thus, the Wout median of its distribution of points is significantly lower with respect the median of Win (P=0.004).
Figure 1B shows that, also concerning the training-induced changes in waist circumference, the box of WCout is positioned lower of that of WCin and the median of WCout has a value significantly less than the median of the WCin (P=0.009).
Also BMI was sensibly reduced after 3 months of controlled exercise training. In fact, figure 1C shows that both the box and the median of BMIout are positioned a bit ‘lower of the box and median concerning BMIin and, probably due to a non excessive dispersion of internal points in each of the two IQR, this difference resulted statistically significant (P=0.004).
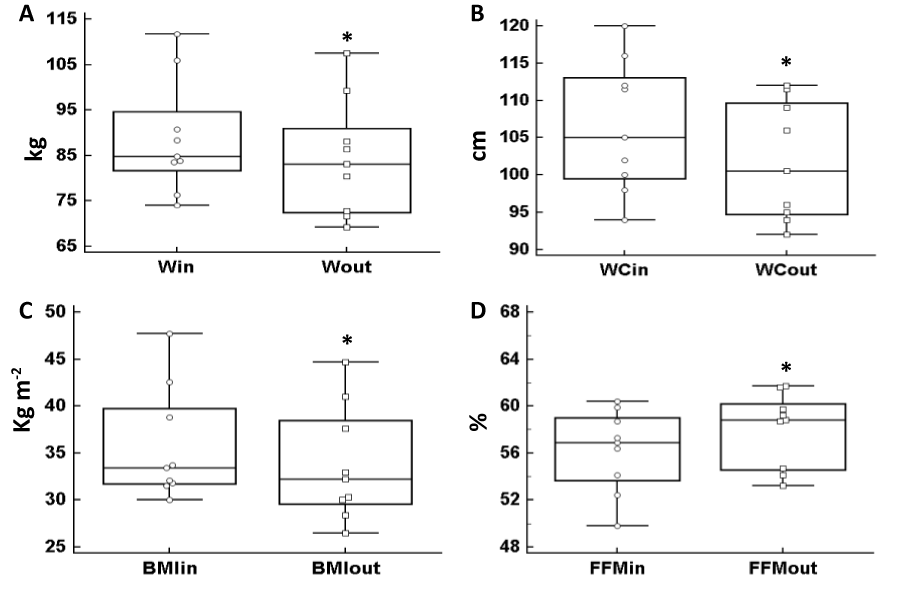
Figure 1: Box and whiskers plots represent the distribution of data assessed before (in) and after (out) the exercise training and concern body mass (W, 1A), waist circumference (WC, 1B), body mass index (BMI, 1C) and free fat mass (FFM, 1D). (*) With respect the in box: difference statistically signifi cant.
Concerning the percentage of free fat mass, the figure 1D clearly indicates that the patients’ FFM was significantly augmented at the Tout with respect to the Tin (P=0.008).
Figure 2A shows that the box and whiskers plot concerning the values of total cholesterol assessed at the Tout (ColTout) is moved downwards with respect to that assessed at the Tin (ColTin), and the lowering of its median, Induced by the exercise training, was statistically significant (P = 0.04). Concerning the HDL (Figure 2B), despite the median of this blood lipoprotein presented a post-exercise (HDLout) increase, when compared to pre-training values (HDLin), it did not reach statistical significance, probably due to the excessive spreading of the points into the HDLout box.
On the contrary, LDLout data showed in figure 2C indicate that in this low density blood lipoprotein occurred a significant decrease induced by physical training when compared to the LDLin data assessed before the physical training (P=0.02).
Finally, figure 2D shows that blood glucose concentration assessed at the Tout (GLYout) was significantly lower (P=0.04) than that assessed at Tin (GLYin) since GLYout median is placed clearly down that of GLYin and the spread of data points in both box is limited.
In figure 3 are represented the training induced responses of the cardiovascular apparatus of the engaged PMOW. Respective positions of box and whiskers concerning data assessed at Tout with respect to the ones assessed at Tin, show a general advantage in hemodynamic profile of these patients after they had performed the supervised exercise training. In fact, both medians of the boxes of SAPout and DAPout are positioned lower with respect to those of SAPin and DAPin boxes. Unfortunately, only the diastolic arterial blood pressure shows a median that is lowered significantly after the training finished (P=0.008).
As shown in figure 3C, HRout shows an enhanced value of its median with respect to that of HRin. However, due to the fact that the box of HRin is embedded into the box of HRout, this heart rate increase shown at the Tout did not reach the statistical significance.
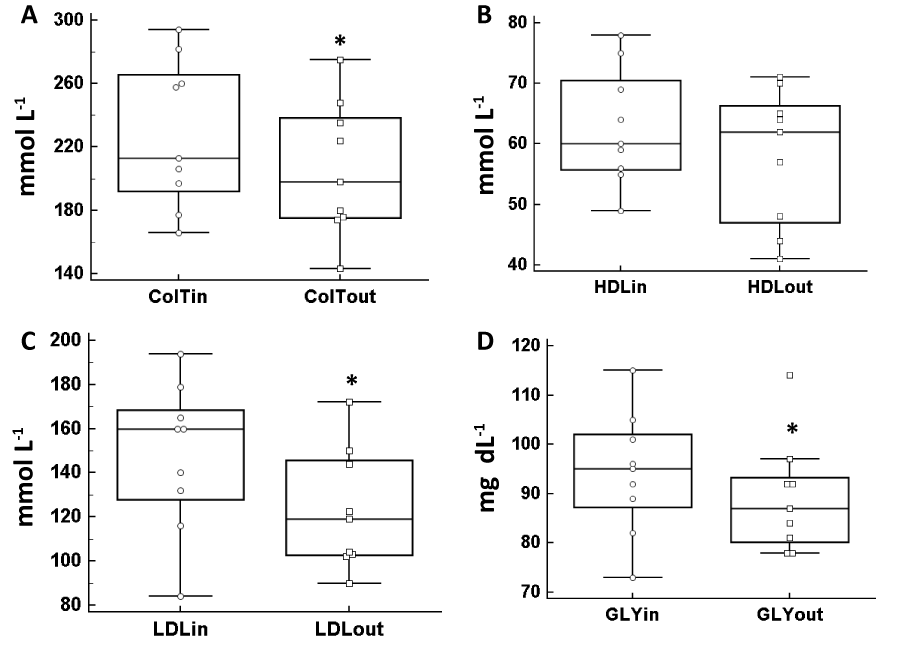
Figure 2: Box and whiskers plots represent the distribution of data assessed before (in) and after (out) the exercise training and concern serum levels of total cholesterol (ColT, 2A), serum levels of high-density lipoprotein cholesterol (HDL, 2B), serum levels of low-density lipoprotein cholesterol (LDL, 2C) and glycaemia (GLY, 2D). An outlier mark is shown outside the whisker from 1st quartiles of GLYout. (*) With respect the in box: difference statistically signifi cant.
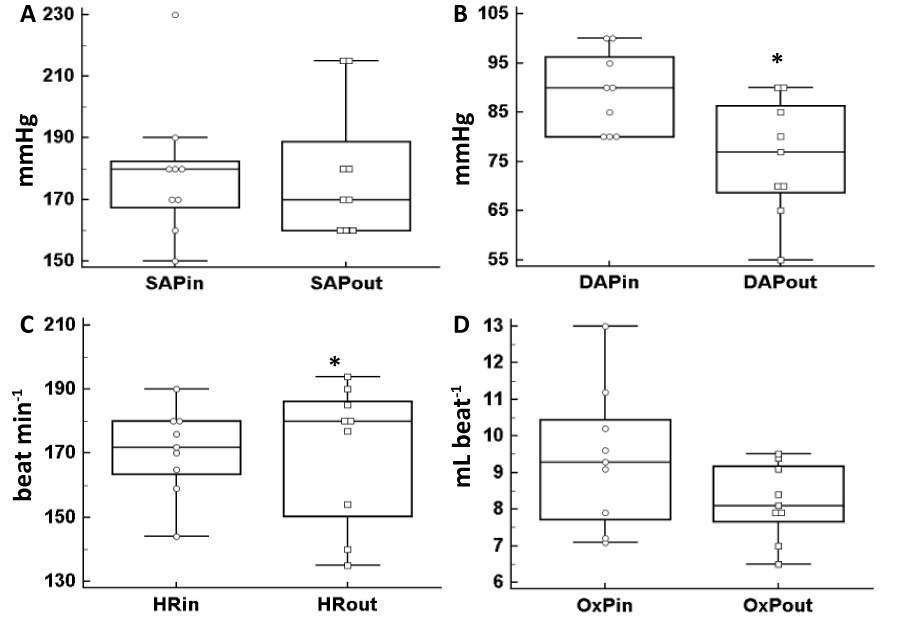
Figure 3: Box and whiskers plots represent the distribution of data assessed before (in) and after (out) the exercise training and concern blood systolic arterial pressure (SAP, 3A), blood diastolic arterial pressure (DAP, 3B), heart rate (HR, 3C) and oxygen pulse (OxP, 3D) assessed at the end of incremental cardiopulmonary test. An outlier mark is shown outside the whisker from 1st quartiles of SAPin. (*) With respect the in box: difference statistically significant.
The box and whiskers of figure 3D concerns the oxygen pulse that, despite the median of the OxPout box results positioned down with respect to that of the OxPin box, the IQR of OxPout is practically contained into the IQR of OxPin. So no statistical difference was found concerning this comparison.
Data shown in figure 4 refered to training induced changes in metabolic and performance variables assessed from the participants to the trials. In figure 4A is evident that despite the median of the box of the maximum oxygen consumption during the CPX at Tout (VO2 out) was higher than that at Tin, the box concerning VO2 out is placed at a lower level with respect that concerning VO2 in, so this conditon impeded to get to a statistically significant difference.
Figure 4b concerns the effects of the controlled exercise training on the maximum capacity of the patients to produce work load during the CPX. Also in this case the median of WATTout was higher than that of WATTin. However, data in both boxes are very spread with a large overlap of the WATTin box into the WATTout box, and the difference did not reach to a statistical significance.
In figure 4C is shown that the maximum oxygen cost of the CPX, which was carried out from the engaged patient, at the Tout was significantly lower (P=0.02) than that at Tin. In fact, the median of the box of COXout is quite lower than that showed in the COWin box and the 3rd quartile in the COXout box is far, down oriented, with respect to that of the COXin.
The six minute walk distance, is shown in figure 4D where is notable that the box concerning DISTout is positioned highly than that concerning DISTin, and the median of DISTout is significantly higher than that of DISTin (P=0.04).
In figure 5 are shown the mean sway areas traced by patients when they were stand, at unipedal stance on the pressure platform, respectively with the right or the left leg. Figure 5A clearly shows that the SwayRout box is totally below to that of the SwayRin, and the median of the former box is significantly reduced with respect to the second (P=0.04).
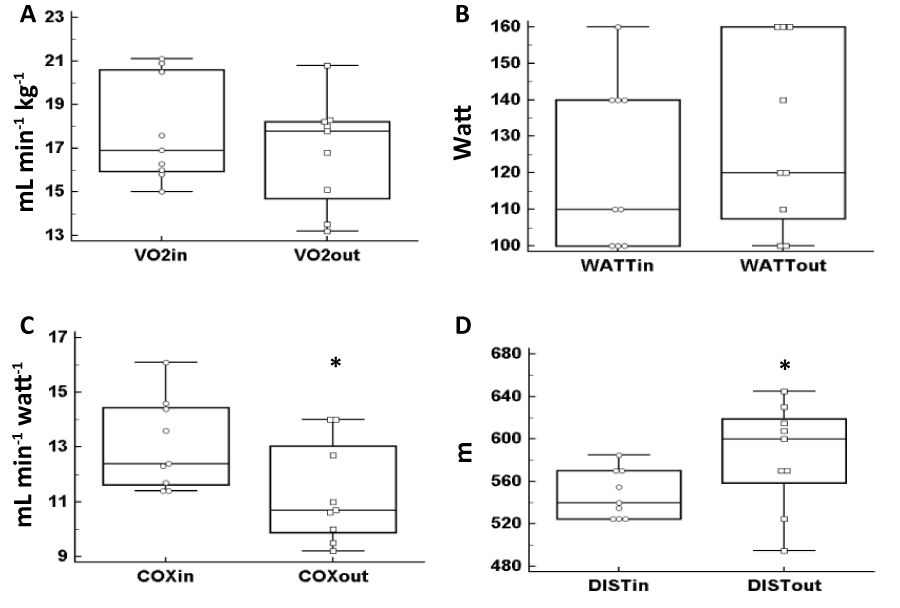
Figure 4: Box and whiskers plots represent the distribution of data assessed before (in) and after (out) the exercise training and concern oxygen consumption (VO2, 4A), workload (WATT, 4B), oxidative cost (COX, 4C) assessed at the end of incremental cardiopulmonary test, and distance covered in the six minute walk test (DIST, 4D). (*) With respect the in box: difference statistically significant.
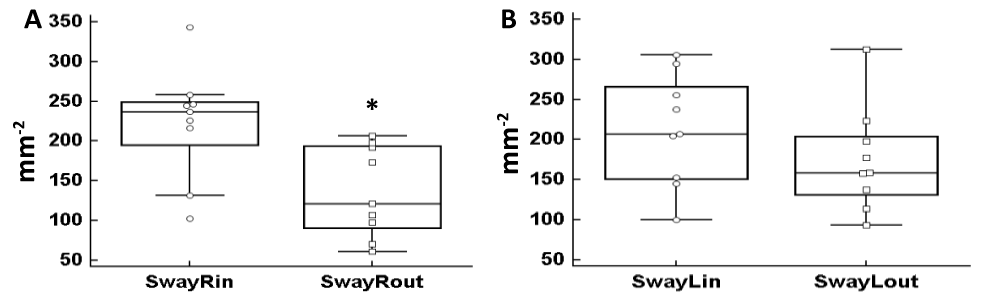
Figure 5: Box and whiskers plots represent the distribution of data assessed before (in) and after (out) the exercise training and concern sway area of the right leg (SwayR, 5A) and sway area of the left leg (SwayL, 5B). Outlier marks are shown outside the whiskers from 1st and 3th quartiles of SwayRin. (*) With respect the in box: difference statistically signifi cant.
When the same test was performed by patients with the left leg (figure 5B) the reduction of the sway area due to the exercise training was less consistent and medians difference between SwayLin and SwayLout did not reach statistical significance.
DISCUSSION
These experimental results seem to indicate that, when the here chosen group of postmenopausal obese women get out of a 3 months physical trial in which the exercise volume was strictly quantified by skilled operators which used instrumental data acquired during the exercise sessions (set at a level corresponding to 50–60 % of the subject’s VO2 max), then many of the variables which concern the anthropometric, cardiopulmonary, metabolic and neuromuscular conditions, tend towards values which might reduce the risk of falling into acute disease with life threatening.
Concerning anthropometric variables, with respect to the pre-training condition these results showed a general and statistically significant tendency to ameliorate posttraining values of body mass and of body mass index which decreased of 2% and of 4% respectively, of the waist circumference which fell towards about -4% of the previous value, and of the free fat mass which gained more than 3%. All these anthropometric changes induced by this prescribed exercise training could be associated with a reduced risk of falling in PMOW [1,5].
At the same time, blood concentrations of total cholesterol and of LDL cholesterol were significantly reduced by more than -6% the one and by quasi -26% the other as well as the glucose blood concentration which fell more than -8% with respect to the pre-training values. As is known, these changes in PMOW blood are in agreement with a reduced cardiovascular risk [13,12,17].
Among the hemodynamic variables considered in these experiments, in our PMOW only the DAP showed a substantial and statistically significant change at the Tout. In fact, the reduction up to about – 14.4% of its pre-training value was a more important cardiodynamic adjustment since it indirectly indicates a structured peripheral vasodilation that, in turn, reduces the heart work to push the blood to the vascular periphery to supply oxygen to exercising muscles, and this could preserve the heart of our PMOW to develop arterial hypertension with left ventricle hypertrophy [31,8,32].
Another valuable consequence that arise in these PMOW from the prescribed exercise training concerned metabolic and performance indicators as are the maximum oxidative cost of work and the distance covered while walking. In fact a statistically significant fall was found in COXout versus COXin (-14%) while DISTout versus DISTin showed a statistically significant increase (+11%).
In these engaged PMOW, both the reduction of oxidative cost at maximum work load and the enhanced distance covered in 6 minutes, as a consequence of 3 month of supervised exercise training, might in part depend on an increased accuracy in their movements made both during the incremental test and during the walk test, thus avoiding unnecessary movements in those body segments involved in the motor chains activated by each of the two functional tests.
That the prescribed exercise training could lead to make the movements more economically by the engaged PMOW, is supported by the post-training great and statistically significant reduction in the sway area (-49%) when patients performed the unipedal stance test on the pressure platform by the dominant (right) leg. In fact, it can be speculated that the sway area reduction in a given participant indicates that her postural control was ameliorated. This latter occurrence could contribute to reduce the amount of unnecessary movements for the execution of a programmed motor skill for which this could lead to a reduction in the oxygen consumption for a given movement, or to a decrease of its oxidative energy cost.
However, due to the small number of study participants, the generalization of our study results needs caution.
STUDY LIMITATIONS
An important limitation in this study may concern the small number of the engaged PMOW. However, to reduce in part this weakness we utilized a non parametric test to evaluate possible exercise-induced effects in the numerous considered variables, and also the box and whiskers plots which consent of better visualize the differences of the Tout versus Tin data assessed for each variable.
Another limitation of this study may concern some outlier markers which are present in figures 2D, 3A and 5A. This may indicate that the measurements would be highly variable mainly due to the small number of study participants.
In order to overcome these limitations, future experiments with large cohorts of participants must be programmed.
CONCLUSION
These experiments, carried out on a small but relatively homogeneous group of postmenopausal obese women, have shown that the administration of physical training protocols in which the prescribed volume of exercise was instrumentally controlled by experienced operators, resulted in a beneficial effect on the quality of life of these patients since they ameliorate some critical anthropometric and functional parameters.
Moreover, this method of exercise training also showed that the improvement of the postural coordination of these obese patients could favour a reduction of the energy cost of their motor activity, from which a better biomechanical efficiency of the walking also occurred
REFERENCES
- Greve J, Alonso A, Bordini AC, Camanho GL. Correlation between body mass index and postural balance. Clinics. 2007; 62: 717-720. Ref.: https://goo.gl/HZ0NXE
- Kejonen P, Kauranen K, Vanharanta H. The relationship between anthropometric factors and body-balancing movements in postural balance. Arch Phys Med Rehabil. 2003; 84: 17-22. Ref.: https://goo.gl/2WiVkE
- Hue O, Simoneau M, Marcotte J, Berrigan F, Doré J, et al. Body weight is strong predictor of postural stability. Gait Posture. 2007; 26: 32-38. Ref.: https://goo.gl/a4iD1D
- Melzer I, Kurz I, Oddsson LI. A retrospective analysis of balance control parameters in elderly fallers and non-fallers. Clin Biomech. 2010; 25: 984-988. Ref.: https://goo.gl/DflVOx
- Hita-Contreras F, Martinez-Amat A, Lomas-Vega R, Alvarez P, Mendoza N, et al. Relationship of body mass index and body fat distribution with postural balance and risk of falls in Spanish postmenopausal women. Menopause. 2013; 20: 202-208. Ref.: https://goo.gl/ajlzoN
- Tesdale N, Hue O, Marcotte J, Berrigan F, Simoneau M, et al. Reducing weight increases postural stability in obese and morbid obese men, Int J Obesity. 2007; 31: 153-160. Ref.: https://goo.gl/aiNdfX
- Bellafiore M, Battaglia G, Bianco A, Paoli A, Farina F, et al. Improved postural control after dynamic balance training in older overweight women. Aging Clin Exp Res. 2011; 23: 378-385. Ref.: https://goo.gl/UGXHya
- Smith-Ryan A, Trexler ET, Wingfi eld H, Blue M. Effects of high-intensity interval training on cardiodynamic risk factors in overweight/obese women. J Sports Sci. 2016; 34: 2038-2046. Ref.: https://goo.gl/WR5Kvn
- Dahjio Y, Noubiap JJN, Azabji-Kenfack M, Essouma M, Loni E, et al. Impact of a 12-week aerobic exercise training program on anthropometric and metabolic parameters of a group of type 2 diabetes Cameroonian aged > 50 years. Ann Transl Medicine. 2016; 4: 364. Ref.: https://goo.gl/VnBO6N
- Tocco F, Sanna I, Mulliri G, Magnani S, Todde F, et al. Heart Rate Unreliability during Interval Training Recovery in Middle Distance Runners. Journal of Sports Science and Medicine. 2015; 14: 466-472. Ref.: https://goo.gl/9wtdaO
- Ghiani G, Marongiu E, Melis F, Angioni G, Sanna I, et al. Body composition changes affect energy cost of running during 12 months of specifi c diet and training in amateur athletes. Appl Physiol Nutr Metab. 2015; 40: 938-944. Ref.: https://goo.gl/59NBoz
- Sturm W, Sandhofer A, Engl J, Laimer M, Molnar C, et al. Infl uence of visceral obesity and liver fat on vascular structure and function in obese subjects. Obesity. 2009; 17: 1783–1788. Ref.: https://goo.gl/SKx2jI
- Mosca L, Manson JE, Sutherland SE, Langer RD, Manolio T, et al. Cardiovascular disease in women: a statement for healthcare professionals from the American Heart Association. Circulation. 1997; 96: 2468–2482. Ref.: https://goo.gl/aIiabx
- Anfossi G, Russo I, Doronzo G, Pomero A, Trovati M. Adipocytokines in atherothrombosis: focus on platelets and vascular smooth muscle cells. Mediators Infl amm. 2010; Article ID 174341, 26 pages. Ref.: https://goo.gl/RoF77q
- Al Suwaidi J, Higano ST, Holmes DR Jr, Lennon R, Lerman A. Obesity is independently associated with coronary endothelial dysfunction in patients with normal or mildly diseased coronary arteries. J Am Coll Cardiol. 2001; 37: 1523–1528. Ref.: https://goo.gl/9DjR2k
- Mason C, Brien SE, Craig CL, Gauvin L, Katzmarzyk PT. Musculoskeletal fi tness and weight gain in Canada. Med Sci Sports & Exer. 2007; 39: 38–43. Ref.: https://goo.gl/cXZ4CH
- Trabka B, Zubrzycki I Z, Ossowski Z, Bojke O, Clarke A, et al. Effect of a MAST exercise program on anthropometric parameters, physical fitness, and serum lipid levels in obese postmenopausal women. J Hum Kinet. 2014; 42: 149-155. Ref.: https://goo.gl/umJRrR
- Morton RH, Fitz-Clarke JR, Banister FW. Modelling human performance running. J Appl Physiol. 1990; 69: 1171-1177. Ref.: https://goo.gl/y17Hc7
- Ciuti C, Marcello C, Macis A, Onnis E, Solinas R, et al. Improved aerobic work capacity by detraining in basketball players mainly trained for strength. Sports Med Train Rehab. 1996; 6: 325-335.
- Velluzzi F, Tocco F, Deledda A, Lai D, Loviselli A, et al. Training impulses: a method to quantify exercise intensity in postmenopausal obese women, Proceedings of the IEEE Symposium on Medical Measurements and Applications. May 15-18, Benevento, Italy. 2016; PP 481-486. Ref.: https://goo.gl/qa3O0E
- Elrik Y, Meldrum DR, Howard LJ. Estrogen levels in postmenopausal women with hot fl ashes. Obstetrics and Ginecology. 1982; 59: 403-407. Ref.: https://goo.gl/99JVgr
- Seven A, Yuksel B, Kabil Kucur S, Yavuz G, Polat M, et al. The evaluation of hormonal and psychological parameters that affect bone mineral density in postmenopausal women. Eur Rev Pharmacol Sci. 2016; 20: 20-25. Ref.: https://goo.gl/oV84Me
- Knowler WC, Barrett-Connor E, Fowler SE, Hamman RF, Lachin JM, et al. Reduction in the incidence of type 2 diabetes with lifestyle intervention or metformin. N Engl J Med. 2002; 346: 393-403. Ref.: https://goo.gl/ANgk0w
- Einright PL. The six-minute walk test. Respiratory Care. 2003; 48: 783-785. Ref.: https://goo.gl/emHiFP
- Crapo RO, Enrught PL, Zeballos RJ. ATS statements: guidelines for the six-minute walk test. Am J Resp Crit Care Med. 2002; 166: 111-117. Ref.: https://goo.gl/jFZPJl
- Pau M, Arrippa F, Leban B, Corona F, Ibba G, et al. Relationship between static and dynamic balance abilitiers in italian professional and youth league soccer players. Phys Ther Sport. 2015; 16: 236-241. Ref.: https://goo.gl/LKFtFk
- Willems T M, De Ridder R, Roosen P. The effect of fatigue on plantar pressure distribution during running in view of running injuries. J Foot Ankle Res. 2012; 5(Suppl 1): P33. Ref.: https://goo.gl/X2HLMZ
- Crisafulli A, Tangianu F, Tocco F, Concu A, Mameli O, et al. Ischemic preconditioning of the muscle improves maximal exercise performance but not maximal oxygen uptake in humans. J Appl Physiol. 2011; 111: 530-536. Ref.: https://goo.gl/Dg6hiL
- Krzywinski M, Altman N. Points of Signifi cance: Visualizing samples with box plots. Nature Methods. 2014; 11: 119-120. Ref.: https://goo.gl/jiHnPs
- Streit M, Gehlenborg N. Points of View: Bar charts and box plots. Nature Methods. 2014; 11: 117. Ref.: https://goo.gl/AHCdd6
- Concu A. ‘Cardiovascular adjustments during exercise: Points and counterpoints’, A Crisafulli & A Concu, Research Signpost,Transworld Reseach Network, Kerala, India, New Insight into Cardiovascular Apparatus during Exercise. Physiological and Physio-pathological Aspects. 2007; 61-83.
- Alpert MA, Omran J, Bostick BP. Effects of obesity on cardiovascular hemodynamics, cardiac morphology and ventricular function. Curr Obes Rep. 2016; 37: 424-434. Ref.: https://goo.gl/lzhqul